|
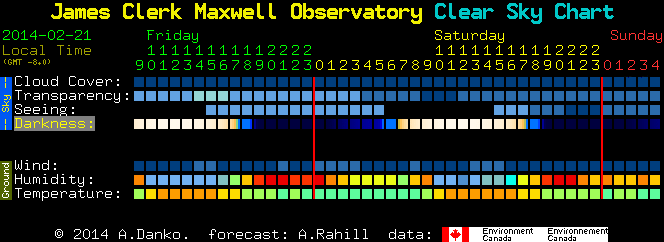
I love the Clear Dark Sky Chart, a geeky little astronomer’s forecast. Also CSC Menu which puts it on a Mac OS menu bar. Here’s a sample image. Above is the forecast for near Grass Valley, CA for the next two days. Time goes from left to right, each row is for a different sky condition: cloud cover, transparency, seeing, and darkness. Also the temperature, humidity, and wind for your backyard comfort. See the legend for details, but basically dark blue is good. Once you learn to read this presentation you can quickly tell if it’s likely to be a good night to look at stars in thousands of locations. Looks like it'll be clear but relatively poor tonight. These charts are derived from a more traditional map forecast prepared by the Canadian Meteorological Center. Their site shows you maps of things like cloud cover by the hour. The Clear Dark Sky site basically samples the pixels at a specific location and displays the time series as a strip chart. Simple and useful. The mysterious seeing forecast is particularly idiosyncratic to astronomy, an experimental forecast of how bad atmospheric distortion is likely to be. |
||

